
Grade 7 · Statistics & Probability · 7.SP.B.3
Comparing Two Data Distributions Worksheets
Free, printable, and ready to teach: a practice worksheet, homework, an exit ticket, and an answer key with step-by-step solutions — plus lesson slides you can edit. No sign-up needed.
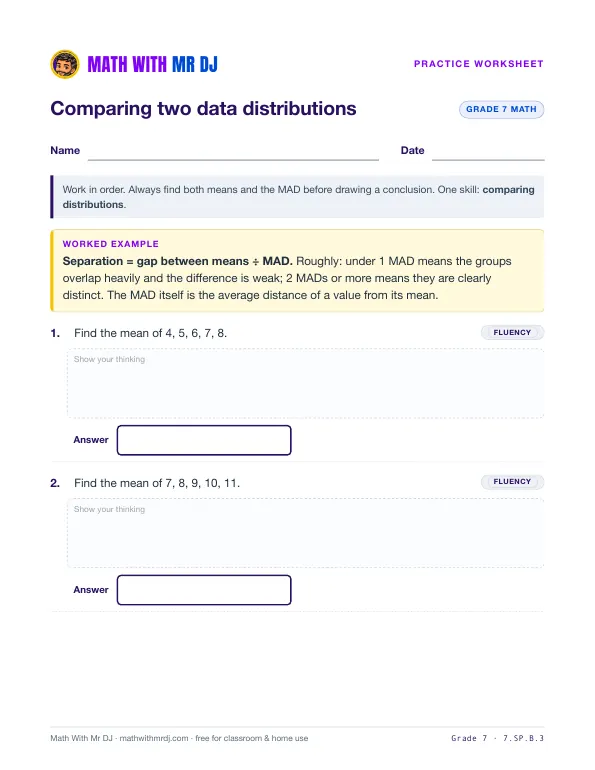 Open the practice worksheet
Download free
- PDFPractice worksheet4 pages · 9 questions
- PDFHomework3 pages · 8 questions
- PDFExit ticket2 pages · 4 questions
- PDFAnswer key with step-by-step solutions8 pages · covers every sheet
- PDFLesson slides8 slides · print or present
- PPTXEditable slidesPowerPoint · opens in Google Slides & Keynote
PDFs print on US Letter paper. Free for classroom and home use.
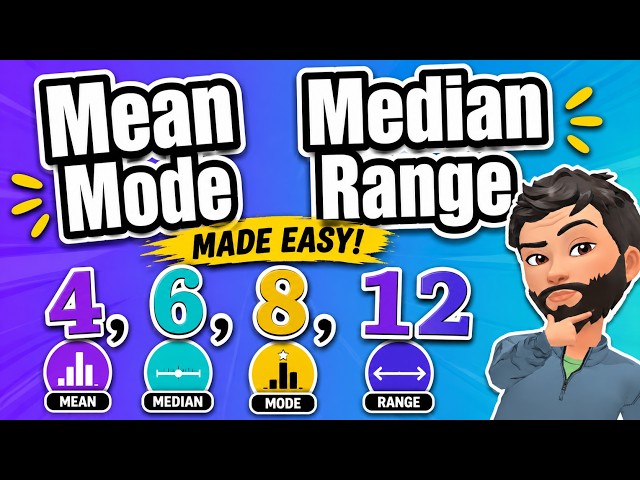 Watch: Mean, Median, Mode, and Range Explained Clearly
Key idea
Separation = gap between means ÷ MAD. Roughly: under 1 MAD means the groups overlap heavily and the difference is weak; 2 MADs or more means they are clearly distinct. The MAD itself is the average distance of a value from its mean.
Sample problems
- Find the mean of 4, 5, 6, 7, 8.
- Find the mean of 7, 8, 9, 10, 11.
- What is the gap between the two means?
- Find the MAD of the first group.
Common mistakes to watch for
- Compared the largest values, or gave the gap as a list of differences.
- Kept the signs when finding distances, getting a MAD of 0. Deviations are always positive.
- Assumed the MAD would also be similar. Same means and same gap, very different spread.
The answer key explains each one, so you can tell what a wrong answer means.
How to use this set
- Teach with the slides (about 15 minutes), or watch the video together.
- Practice with the worksheet. Questions climb from fluency to application to reasoning.
- Check understanding with the exit ticket, and send the homework home.
- Mark with the answer key — each answer shows the steps and the most likely mistake.
More Grade 7 worksheets
All Grade 7 →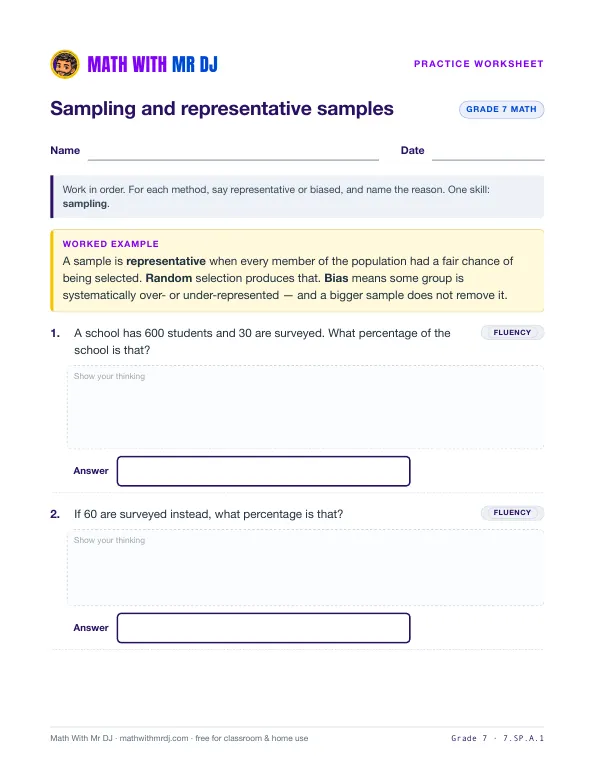 Sampling and Representative Samples7.SP.A.1 · Practice · Homework · Exit ticket · Answer key · Slides
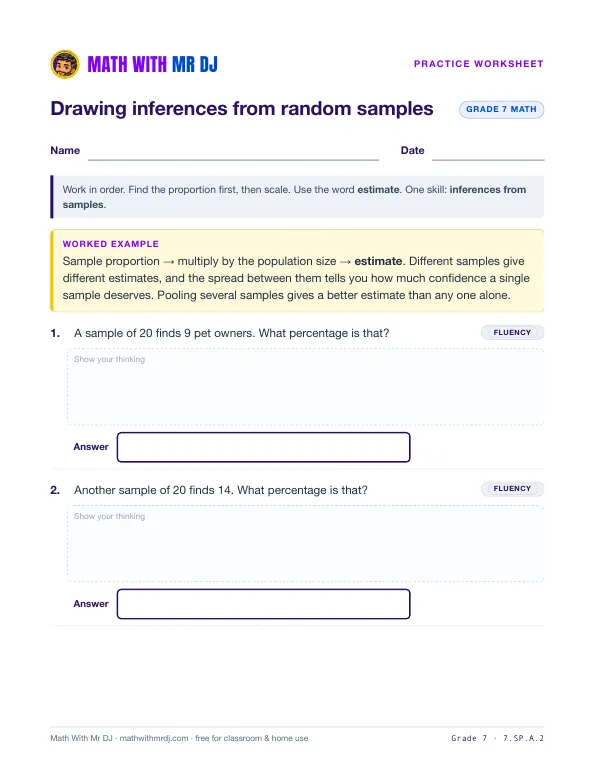 Drawing Inferences from Random Samples7.SP.A.2 · Practice · Homework · Exit ticket · Answer key · Slides
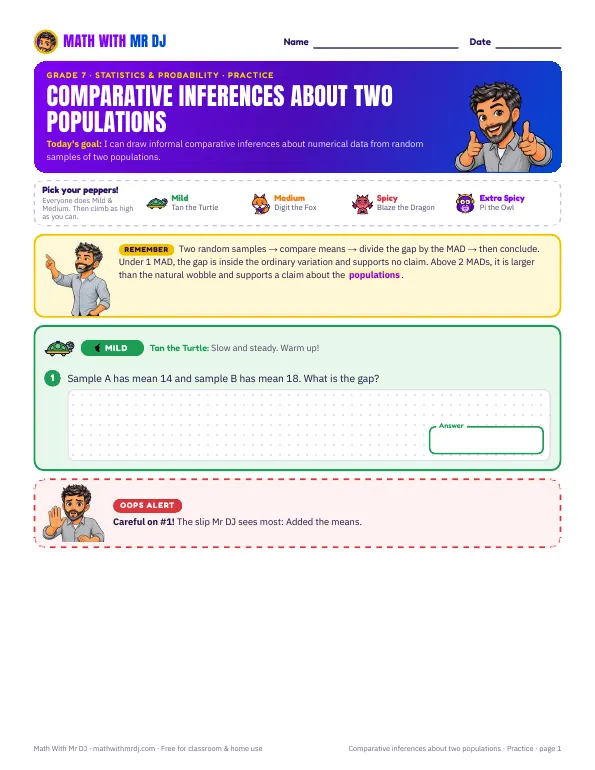 Comparative Inferences About Two Populations7.SP.B.4 · Practice · Homework · Exit ticket · Answer key · Slides▶ Video lesson
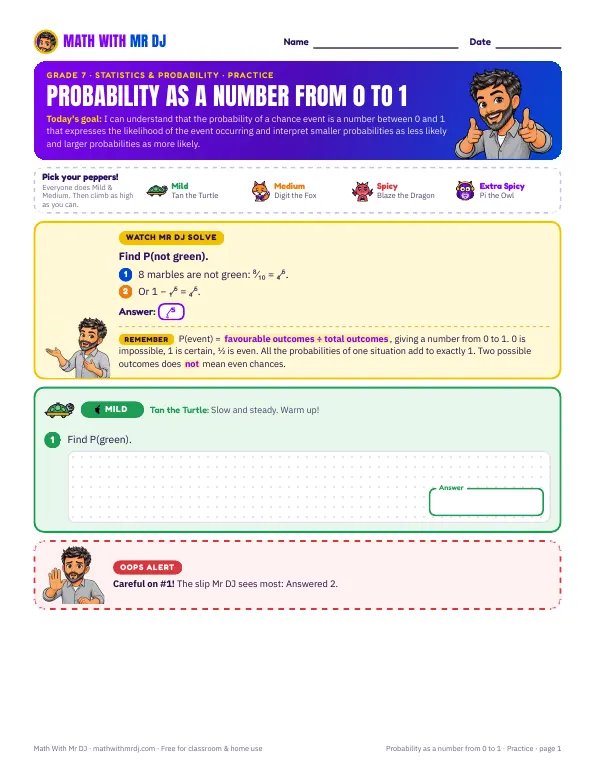 Probability as a Number from 0 to 17.SP.C.5 · Practice · Homework · Exit ticket · Answer key · Slides
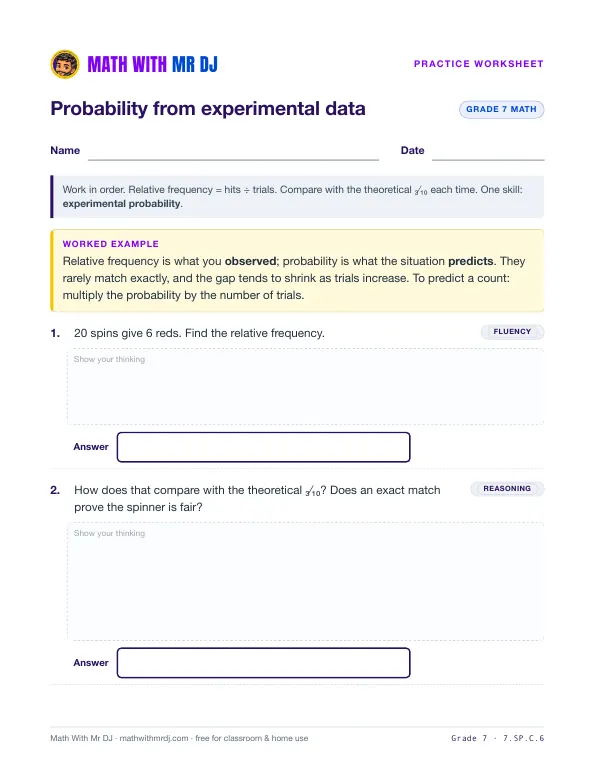 Probability from Experimental Data7.SP.C.6 · Practice · Homework · Exit ticket · Answer key · Slides
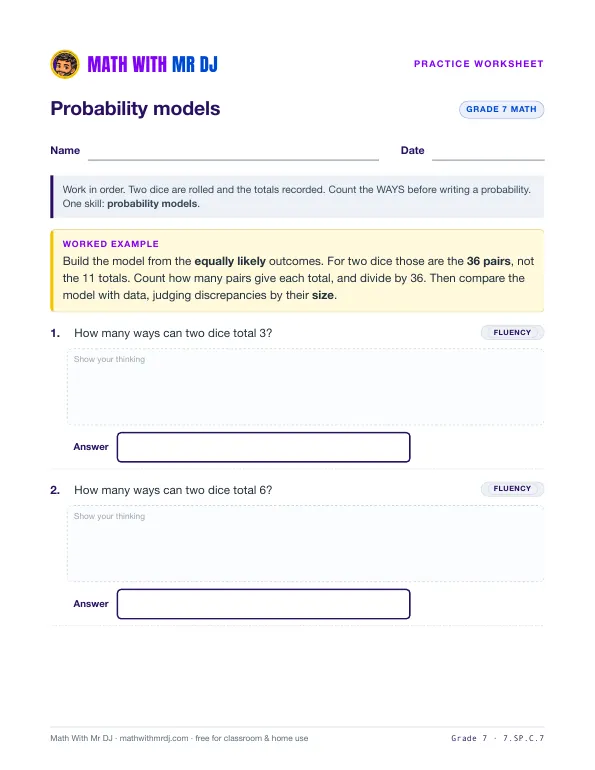 Probability Models7.SP.C.7 · Practice · Homework · Exit ticket · Answer key · Slides


Get new worksheets first
New worksheets, videos, and free resources from Mr DJ — about once a month. No spam, ever.