
Grade 6 · Statistics & Probability · 6.SP.B.4
Displaying Data in Dot Plots Worksheets
Free, printable, and ready to teach: a practice worksheet, homework, an exit ticket, and an answer key with step-by-step solutions — plus lesson slides you can edit. No sign-up needed.
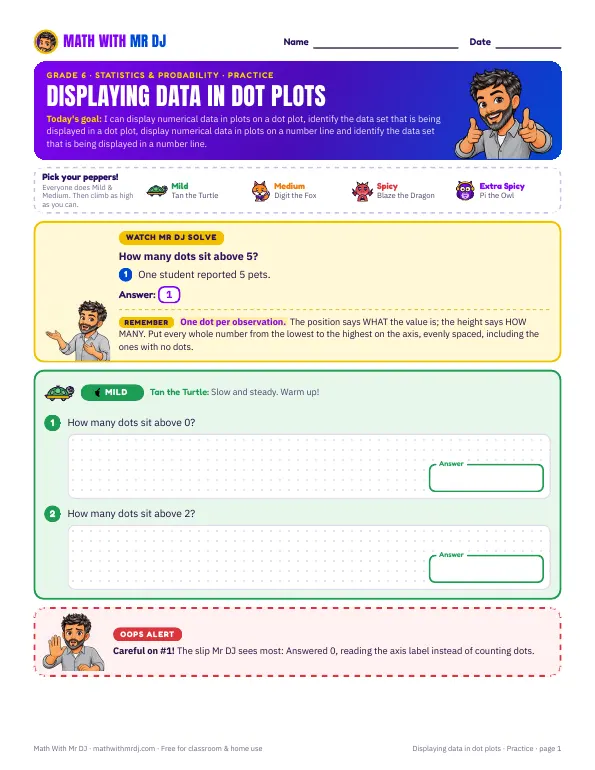 Open the practice worksheet
Download free
- PDFPractice worksheet3 pages · 9 questions
- PDFHomework3 pages · 8 questions
- PDFExit ticket2 pages · 4 questions
- PDFAnswer key with step-by-step solutions8 pages · covers every sheet
- PDFLesson slides8 slides · print or present
- PPTXEditable slidesPowerPoint · opens in Google Slides & Keynote
PDFs print on US Letter paper. Free for classroom and home use.
Step-by-step math videos on the Math With Mr DJ YouTube channel →Key idea
One dot per observation. The position says WHAT the value is; the height says HOW MANY. Put every whole number from the lowest to the highest on the axis, evenly spaced, including the ones with no dots.
Sample problems
- How many dots sit above 0?
- How many dots sit above 2?
- How many dots sit above 5?
- What is the range of the data?
Common mistakes to watch for
- Drew 5 dots, one per DIFFERENT value. A dot plot shows every observation, not every distinct answer.
- Said the tallest stack means ‘4 pets’. The height counts students; the position on the axis gives the number of pets.
- Left 4 off the axis so the dots sat side by side. That distorts the spacing and hides the outlier.
The answer key explains each one, so you can tell what a wrong answer means.
How to use this set
- Teach with the slides (about 15 minutes), or watch the video together.
- Practice with the worksheet. Questions climb from fluency to application to reasoning.
- Check understanding with the exit ticket, and send the homework home.
- Mark with the answer key — each answer shows the steps and the most likely mistake.
More Grade 6 worksheets
All Grade 6 →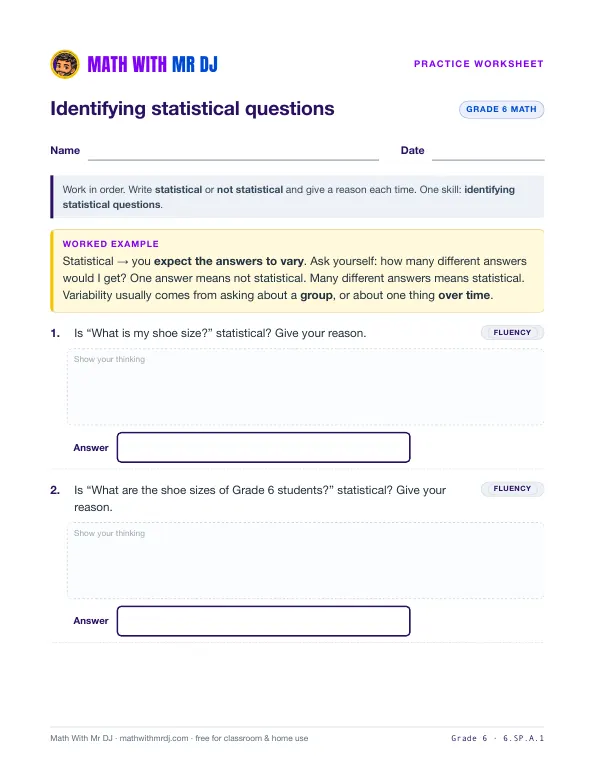 Identifying Statistical Questions6.SP.A.1 · Practice · Homework · Exit ticket · Answer key · Slides
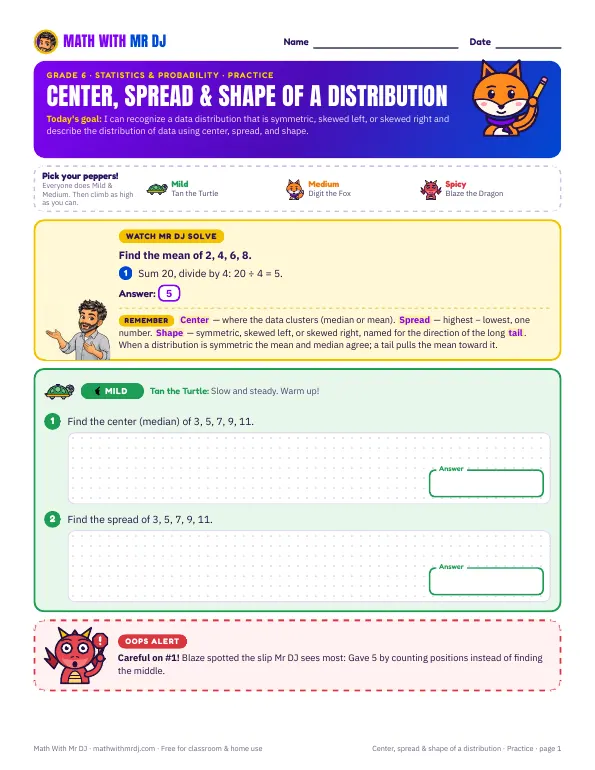 Center, Spread & Shape of a Distribution6.SP.A.2 · Practice · Homework · Exit ticket · Answer key · Slides▶ Video lesson
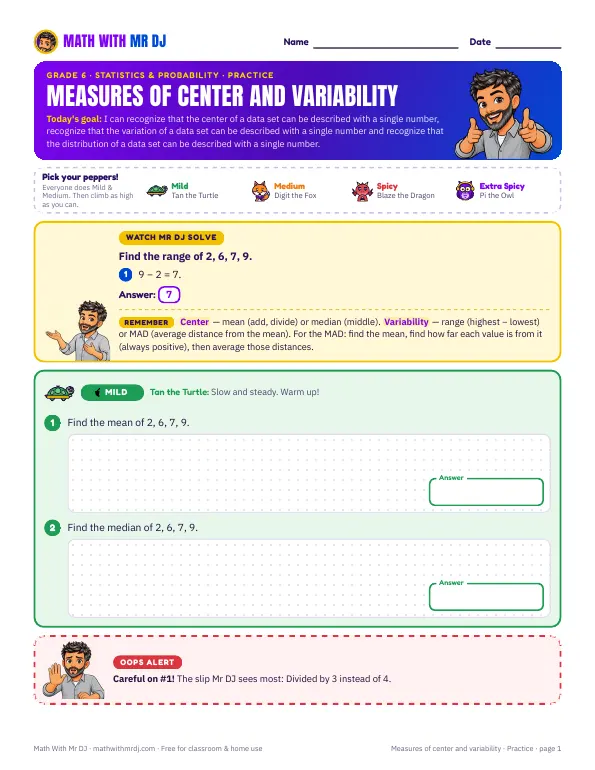 Measures of Center and Variability6.SP.A.3 · Practice · Homework · Exit ticket · Answer key · Slides▶ Video lesson
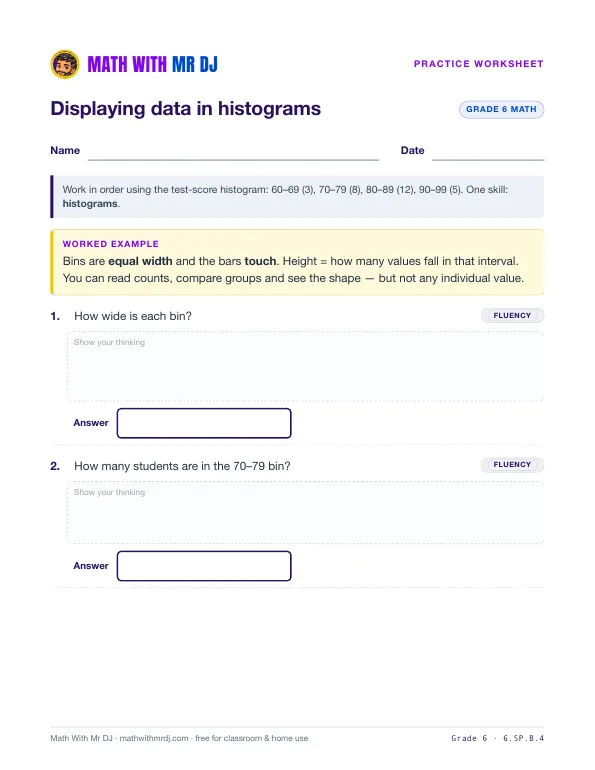 Displaying Data in Histograms6.SP.B.4 · Practice · Homework · Exit ticket · Answer key · Slides
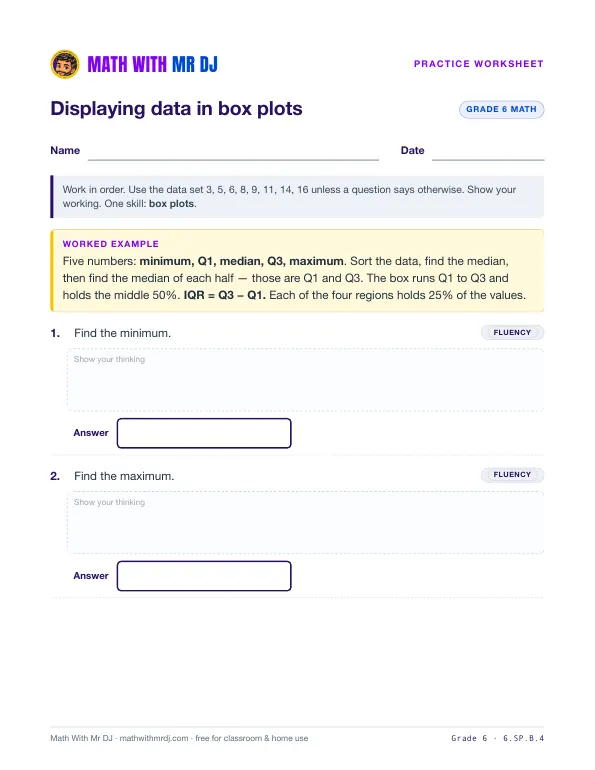 Displaying Data in Box Plots6.SP.B.4 · Practice · Homework · Exit ticket · Answer key · Slides
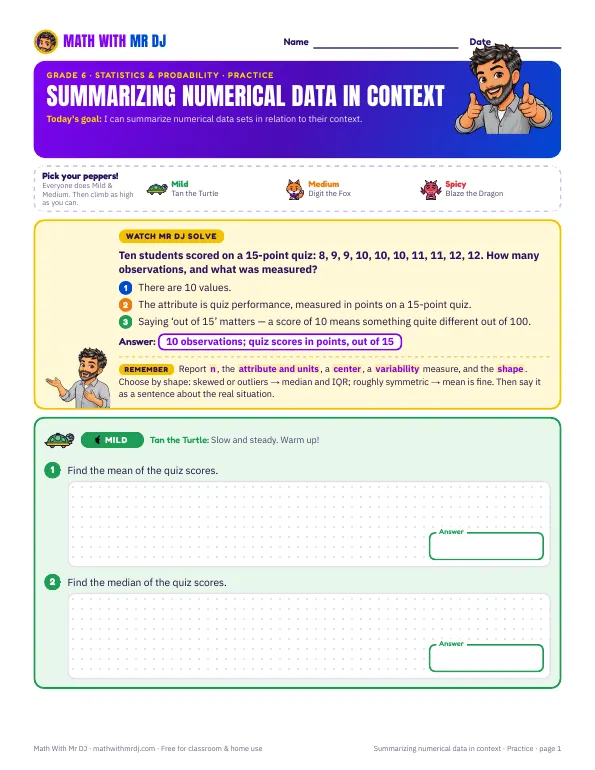 Summarizing Numerical Data in Context6.SP.B.5 · Practice · Homework · Exit ticket · Answer key · Slides▶ Video lesson


Get new worksheets first
New worksheets, videos, and free resources from Mr DJ — about once a month. No spam, ever.