
Grade 6 · Statistics & Probability · 6.SP.B.5
Summarizing Numerical Data in Context Worksheets
Free, printable, and ready to teach: a practice worksheet, homework, an exit ticket, and an answer key with step-by-step solutions — plus lesson slides you can edit. No sign-up needed.
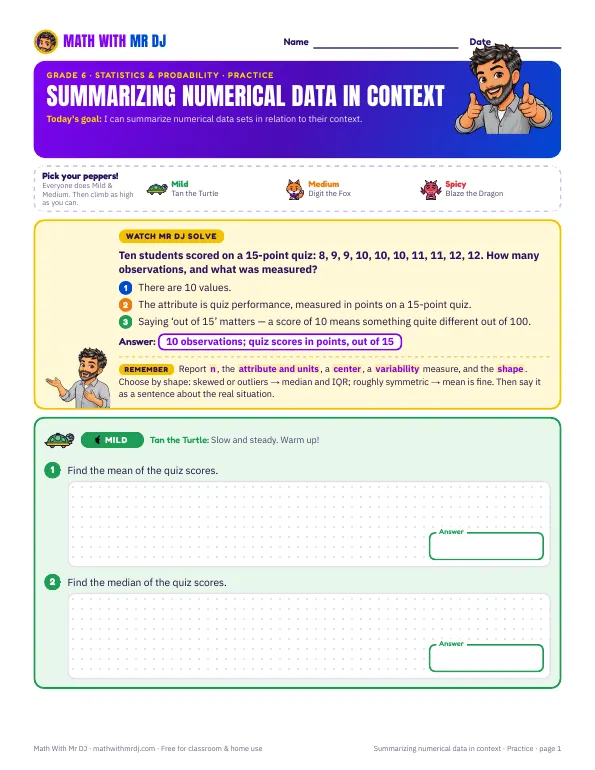 Open the practice worksheet
Download free
- PDFPractice worksheet4 pages · 9 questions
- PDFHomework3 pages · 8 questions
- PDFExit ticket2 pages · 4 questions
- PDFAnswer key with step-by-step solutions9 pages · covers every sheet
- PDFLesson slides8 slides · print or present
- PPTXEditable slidesPowerPoint · opens in Google Slides & Keynote
PDFs print on US Letter paper. Free for classroom and home use.
 Watch: Mean, Median, Mode, and Range Explained Clearly
Key idea
Report n, the attribute and units, a center, a variability measure, and the shape. Choose by shape: skewed or outliers → median and IQR; roughly symmetric → mean is fine. Then say it as a sentence about the real situation.
Sample problems
- Ten students scored on a 15-point quiz: 8, 9, 9, 10, 10, 10, 11, 11, 12, 12. How many observations, and what was measured?
- Find the mean of the quiz scores.
- Find the median of the quiz scores.
- Compare the mean and the median. What does the comparison suggest about the shape?
Common mistakes to watch for
- Answered ‘12’ with nothing else. The count alone does not say what was counted or in what units.
- Dropped the units. Both answers are in minutes and should say so.
- Reported only the range. On this data the range is dominated by one value and badly overstates the typical spread.
The answer key explains each one, so you can tell what a wrong answer means.
How to use this set
- Teach with the slides (about 15 minutes), or watch the video together.
- Practice with the worksheet. Questions climb from fluency to application to reasoning.
- Check understanding with the exit ticket, and send the homework home.
- Mark with the answer key — each answer shows the steps and the most likely mistake.
More Grade 6 worksheets
All Grade 6 →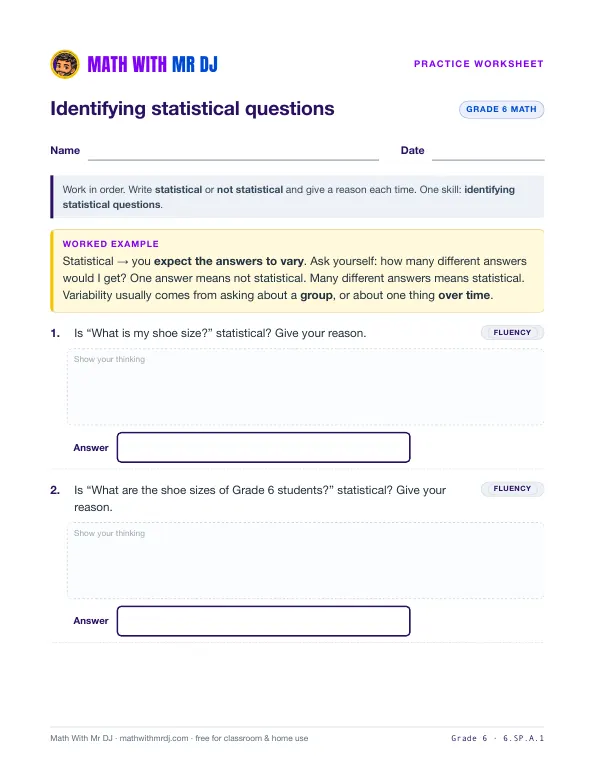 Identifying Statistical Questions6.SP.A.1 · Practice · Homework · Exit ticket · Answer key · Slides
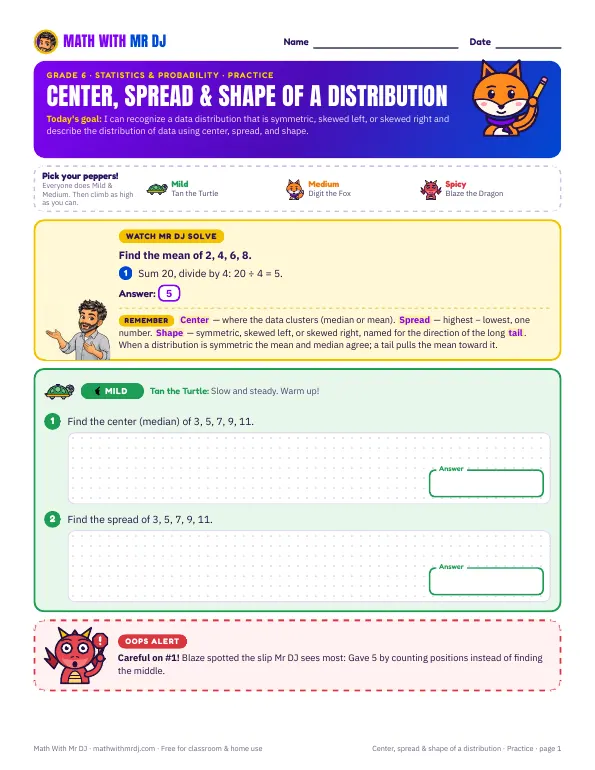 Center, Spread & Shape of a Distribution6.SP.A.2 · Practice · Homework · Exit ticket · Answer key · Slides▶ Video lesson
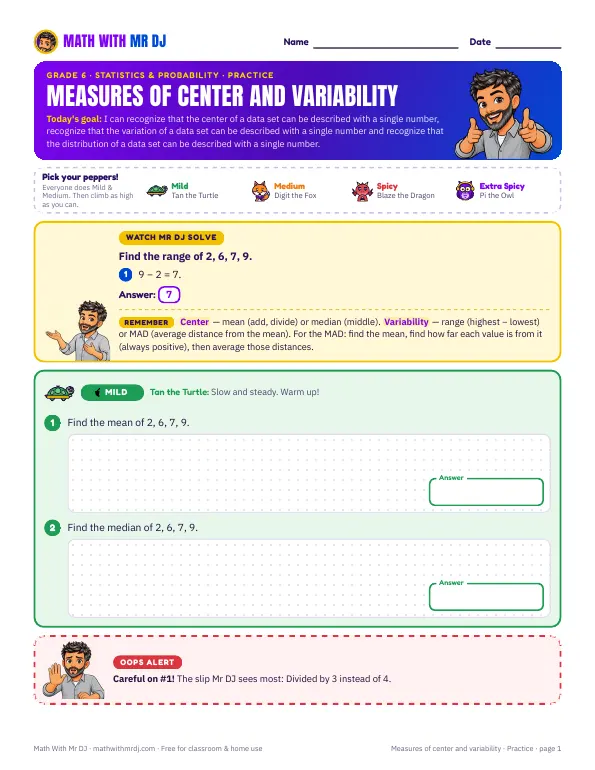 Measures of Center and Variability6.SP.A.3 · Practice · Homework · Exit ticket · Answer key · Slides▶ Video lesson
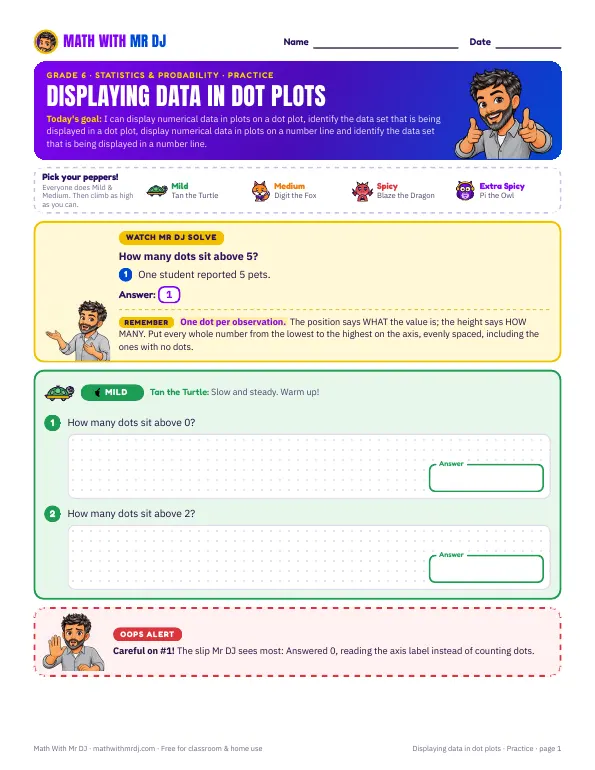 Displaying Data in Dot Plots6.SP.B.4 · Practice · Homework · Exit ticket · Answer key · Slides
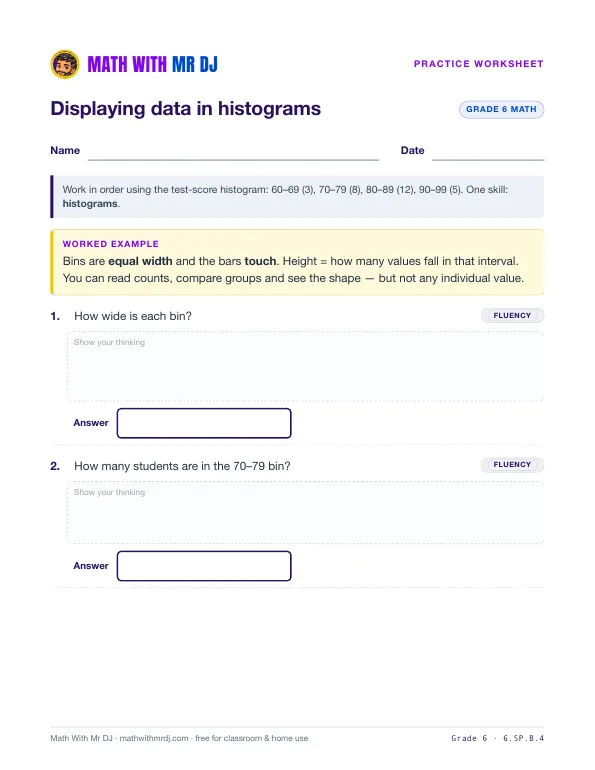 Displaying Data in Histograms6.SP.B.4 · Practice · Homework · Exit ticket · Answer key · Slides
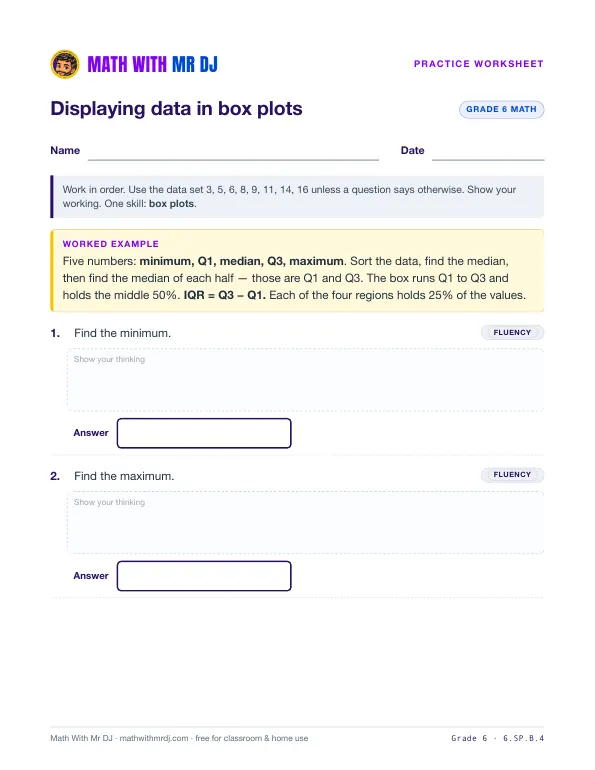 Displaying Data in Box Plots6.SP.B.4 · Practice · Homework · Exit ticket · Answer key · Slides


Get new worksheets first
New worksheets, videos, and free resources from Mr DJ — about once a month. No spam, ever.